

Andrew Langley
Back-to-back Supercoach BBL winner


2x Supercoach BBL Champion Andrew Langley tells us how to use last years stats to help with building our Supercoach sides ahead of BBL|15
BBL
Back-to-back Supercoach BBL winner
November 13, 2025
G’day Supercoaches,
As we get ready for the BBL SuperCoach season, Max Bryden has already been busy sharing his knowledge to predict team lineups to help us all start and plan our SuperCoach BBL|15 journey.
Something that I often start thinking about is how we approach targeting the type of players that we may want.
Therefore, I thought that I would share some of the stats that I collected from last year to help demonstrate how scoring changes with role.
Whilst the game keeps changing and every season is different, fluctuations from year to year never seem to be excessive, so I always find it a good exercise to use the most recent season for determining where points may be scored this year.
Point scoring for BBL SuperCoach is fairly straightforward, with players accumulating points based on their performance when they bat and field, with fielding points made up of both bowling figures and points scored for general fielding – catches, runouts, and stumpings.
Last year, 46% of the overall points allocated were awarded for batting, 43% for bowling, and the remaining 11% for fielding.
So I thought that I would start by exploring those three facets of the game separately before bringing it all together.
Embed from Getty ImagesLogic says that the more opportunities a player has to score, the higher they should be able to score.
Therefore, given the limited overs available in T20, the higher someone bats up the batting order, the more points they should be able to score, given those who bat lower won’t always get a chance to face as many balls, or even bat at all.
Looking at last year’s SuperCoach batting points averaged by batting position in Table 1 below, the logic seems to hold – batters who batted in the top 5 were consistent, before average scores started to drop away sharply.
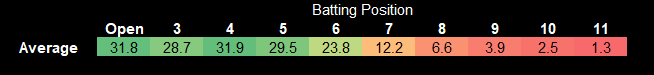
Table 1: Average SuperCoach batting points by batting position in BBL|14
However, given this is an average, it doesn’t highlight how differently the better players may have scored.
I have explained in previous articles how I try and maximise scoring involvement and aim for an average of 55 points per score involvement (PSI).
Therefore, I have also decided to extract the players who would have averaged 55 PSI and the players who were below that average 55 PSI figure.
Last year, there were 57 players where you combined all of their game scores, they had a combined average of 55 PSI.
This was everyone, including Josh Philippe, who averaged at or above his average total SuperCoach score of 41.6.
Embed from Getty ImagesTable 2 below compares the average batting points shown above with the average of those 57 players, along with the average of the other 93 players who averaged below Philippe.
Comparing these two groups to the average shows that there is a significant points difference between the players in form and the others.
However, it also demonstrates that there is a drop off in batting points the further a player bats down the order, no matter how good he is.
In addition, the difference between the average score and the better players’ average lessens the further we drop down the batting order.
Having said that, in form players who bat in the top 3 held up to a 50% advantage over the average batting score for those positions.
So if we are targeting in-form batters, ideally we want to look at those who bat in the top 3.
However, even the best average of 45.9 for in-form players (openers) falls short of our 55 PSI target, so players also need points in the field to get there.
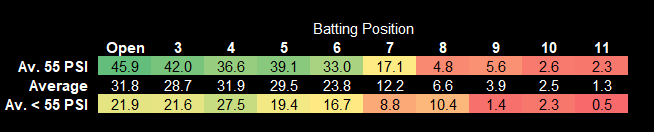
Table 2: Average SuperCoach batting points by batting position in BBL|14, comparing the players who averaged above 41.5 PSI (Combined average 55 PSI) with those who averaged below.
So in summary, as we prepare for BBL|15, last year’s batting figures confirm that not only do we want to be considering batters who are in form, but we need to target those who bat up the order if we want to maximise scoring advantage.
Embed from Getty ImagesThe next thing I want to look at is the non-bowling fielding points from last year to get a sense of how much advantage can be gained in the field by the players who take catches or initiate runouts and stumpings.
In Table 3, I decided to once again compare the points average with the players collectively averaging 55 PSI and those who averaged below 55 PSI, whilst also looking at the difference in scoring by separating out the wicketkeepers from the others, as I felt that wicketkeepers get more opportunities to score fielding points.
I have also compared the fielding points between non-wicketkeepers who didn’t bowl and those who did to see if there was a type of player who may score more.
However, as can be seen, the points differential between those two groups of players was minimal, so it can probably be discounted.
The other point of note with fielding points is that, unlike batting scoring, there was very little difference between the elite average scorers and the others.
It felt low, so I decided to look it up and sure enough, there were only four players who didn’t keep wicket and averaged more than 10 fielding points per match – Glen Maxwell (16.1), Andrew Tye (11.7), Ben Duckett (11.4 – didn’t wicketkeep in BBL|14), and Mitch Owen (11.1) and only one of these elite fielders, Maxwell, averaged higher than the average wicketkeeper.
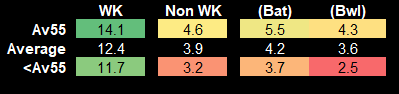
Table 3: Average SuperCoach fielding points in BBL|14 for catches, runouts, and stumpings comparing the players who averaged above 41.5 PSI (Combined average 55 PSI) with those who averaged below.
So, apart from wicketkeepers gaining around 10 points on non-wicketkeepers, there is not a huge advantage to be made from this aspect of the game in terms of overall SuperCoach score.
Embed from Getty ImagesThe final part of point scoring is bowling, and Table 4 demonstrates that on average, the more balls a player bowled in a match, the more bowling points he scored.
Whilst I was splitting the sections into overs, I noticed that there was a jump in player scoring once they completed their third over (18 balls).
This makes sense as there are run-rate bonuses that come into play once three overs are completed.
I also noticed that there was not a huge difference in average between those who bowled three overs and those who got a fourth over, so I grouped the average for bowling 18 to 24 balls. In addition, there was not much difference between players who started a second over but didn’t complete a third over, so I also made a grouping for those who bowled 7 to 17 balls.
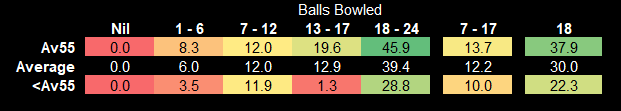
Table 4: Average SuperCoach bowling points by balls bowled in BBL|14, comparing the players who averaged above 41.5 PSI (Combined average 55 PSI) with those who averaged below.
Like with the batting points, there was quite a gap between the elite scorers and the average; however, the gap was not as large as it was with the batters.
The gap did increase, though, with more deliveries bowled.
The big jump in bowling points does come once that third over is completed, so we need to be targeting bowlers where team structure indicates that they are likely to bowl at least three overs.

Now that we have broken down the points for last year, we can develop a table on how combined roles would equate to expected scores.
Table 5 highlights how the more involvement someone has in the game, the more SuperCoach points they score. Using the figures from above, rounded to the nearest whole number, shows that the highest points come from someone who bats in the top 4-5 and bowls 3-4 overs, and the lowest scores come from someone who bats down the order and doesn’t bowl.
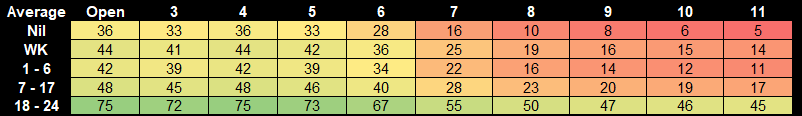
Table 5: Using the Batting, Fielding & Bowling points averages from BBL|14 to develop expected points by role
Whilst using the expected points table is good in theory, I wanted to test it against the real averages that were scored for each role combination to see if it holds up.
For example, did the batters who batted high up the order and bowled 3-4 overs score well, or because they were likely stronger batsmen than bowlers, was their scoring lower than expected?
Likewise, did bowlers who batted lower down the order and bowled four overs score better than expected?
Embed from Getty ImagesTable 6 below shows that all combinations, apart from wicketkeepers batting at 8 or lower, happened last year.
Therefore, the two tables can be compared.
The second part of Table 6 shows how often that scoring combination happened in BBL|14, so the more times a role was played, the more accurate we can expect the figures to be.
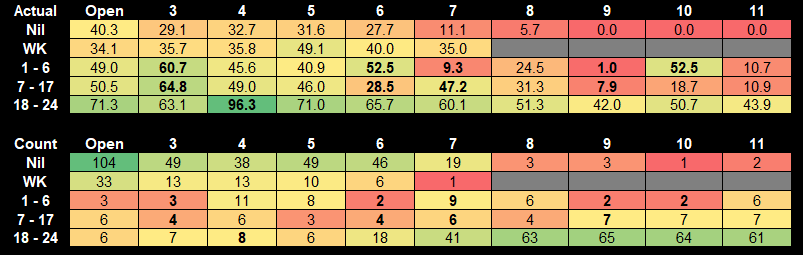
Table 6: BBL|14 averages by actual role played and game count for that role.
This shows that actual scoring for each role combination was pretty consistent with the predicted scoring table that used separate averages.
The role combinations that were out by more than 10 points have been bolded, and the second part of the table shows that they were roles that were not frequently played, which could explain the swing in scoring.
Embed from Getty ImagesA lot of those inconsistencies were players who bowled between 1 and 2.5 overs, which may be the result of a good bowler having a bad couple of overs and not getting his full allotment (thus scoring low) or a lesser bowler who wasn’t expected to get many overs snagging a wicket and maybe getting another over (thus scoring higher).
So, in conclusion, these numbers confirm the thinking with regard to more points going to players who have more of a role in the game.
It also helps with working out which players may be offering value, or otherwise, with their starting price.
Seeing these figures helps us to think through where we may need to temper expectations when players are overpriced or have unfavourable roles, no matter how good they are.
You must be logged in to post a comment.
Great article mate, really highlights picking a bowler who will bowl 4 and bat even 7/8 is better than a bat only